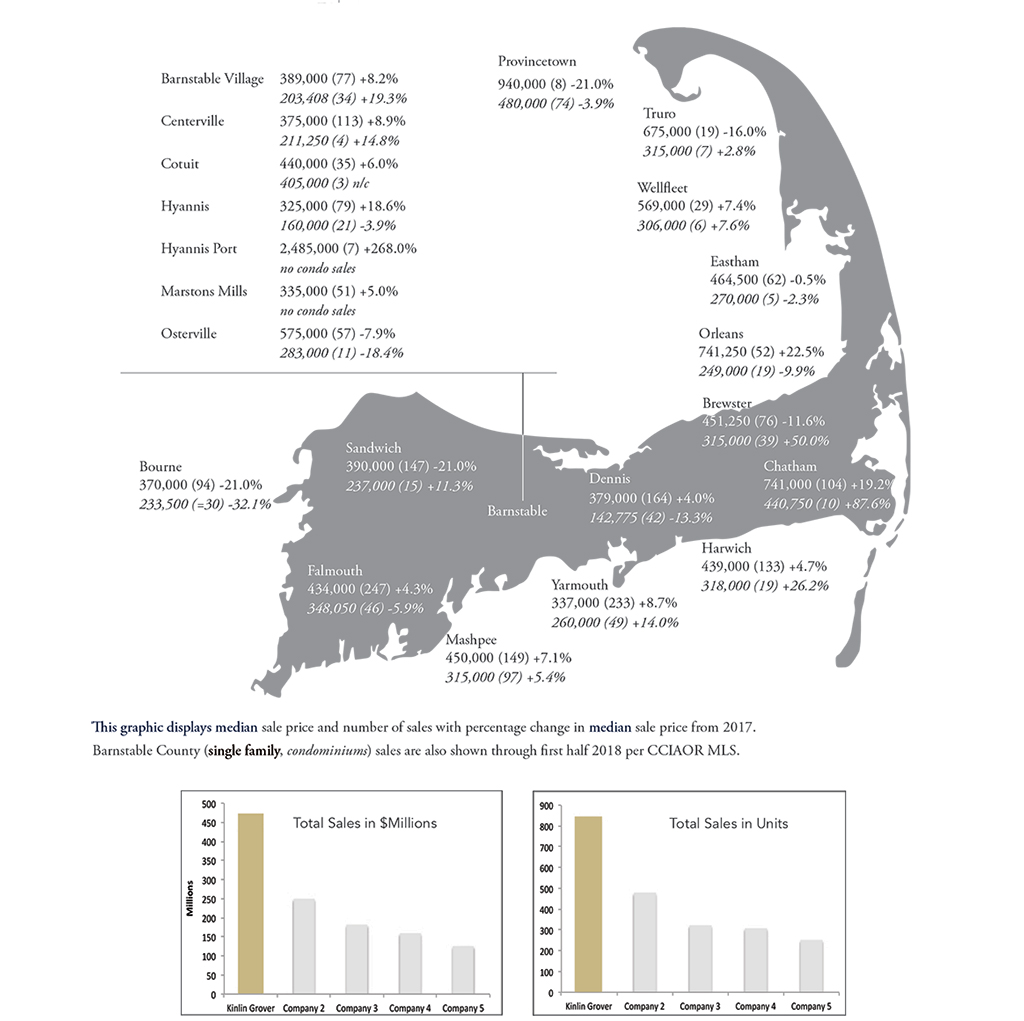
With Cape Cod's limited inventory of available properties, home prices have continued their upward trend while the pace of sold properties has slowed and days on market has declined. While no one can predict how long the current situation will last, currently sellers have the advantage. Simply put, there are many active buyers looking for a Cape Cod home and not enough properties to sell them. This is resulting in upward price pressure, particularly in the luxury and near-luxury price ranges. Note the heavy concentration of sales in the $500,000-$749,999 price group. If you are a seller who is "on the fence" now is really the time to put your home on the market. Demand is high, interest rates are still low, and history tells us that markets are always changing.
| All Kinlin Grover Sales | 2017 | 2018 | % Change |
|---|---|---|---|
| Sales | 688 | 843 | + 22.5 |
| Average Sale Price | $462,105 | $518,559 | + 12.2 |
| Median Sale Price | $383,000 | $462,150 | + 20.5 |
| Cape Cod High-End Single Family |
2017 | 2018 | % Change |
|---|---|---|---|
| Sales | 228 | 237 | + 4.0 |
| Average Sale Price | $1,853,819 | $2,050,132 | + 10.5 |
| Median Sale Price | $1,448,350 | $1,525,000 | + 5.2 |
| Cape Cod Condominiums | 2017 | 2018 | % Change |
|---|---|---|---|
| Sales | 501 | 507 | + 1.0 |
| Average Sale Price | $327,244 | $341,000 | + 4.2 |
| Median Sale Price | $257,500 | $289,500 | + 12.4 |
| Days On Market | 154 | 113 | - 27.0 |
| Cape Cod Single Family Sales |
2017 | 2018 | % Change |
|---|---|---|---|
| Sales | 4164 | 3786 | - 9.1 |
| Average Sale Price | $523,349 | $566,599 | + 8.2 |
| Median Sale Price | $388,000 | $417,624 | + 7.6 |
| Days On Market | 152 | 124 | - 18.4 |
| High End Sales | 2017 | 2018 | % Change |
|---|---|---|---|
| Sales | 48 | 57 | + 18.8 |
| Average Sale Price | $1,481,333 | $1,750,425 | + 18.2 |
| Median Sale Price | $1,350,000 | $1,500,000 | + 10.0 |
| Days On Market | 426 | 372 | - 12.7 |
| Residential Sales Distribution |
2017 | 2018 | % Change |
|---|---|---|---|
| Under $350,000 | 468 | 379 | - 19.0 |
| $350,000 - $499,999 | 285 | 245 | - 14.0 |
| $500,000 - $749,999 | 132 | 163 | + 23.5 |
| $750,000 - $999,999 | 54 | 56 | + 3.7 |
| $1 Million+ | 64 | 61 | - 4.7 |