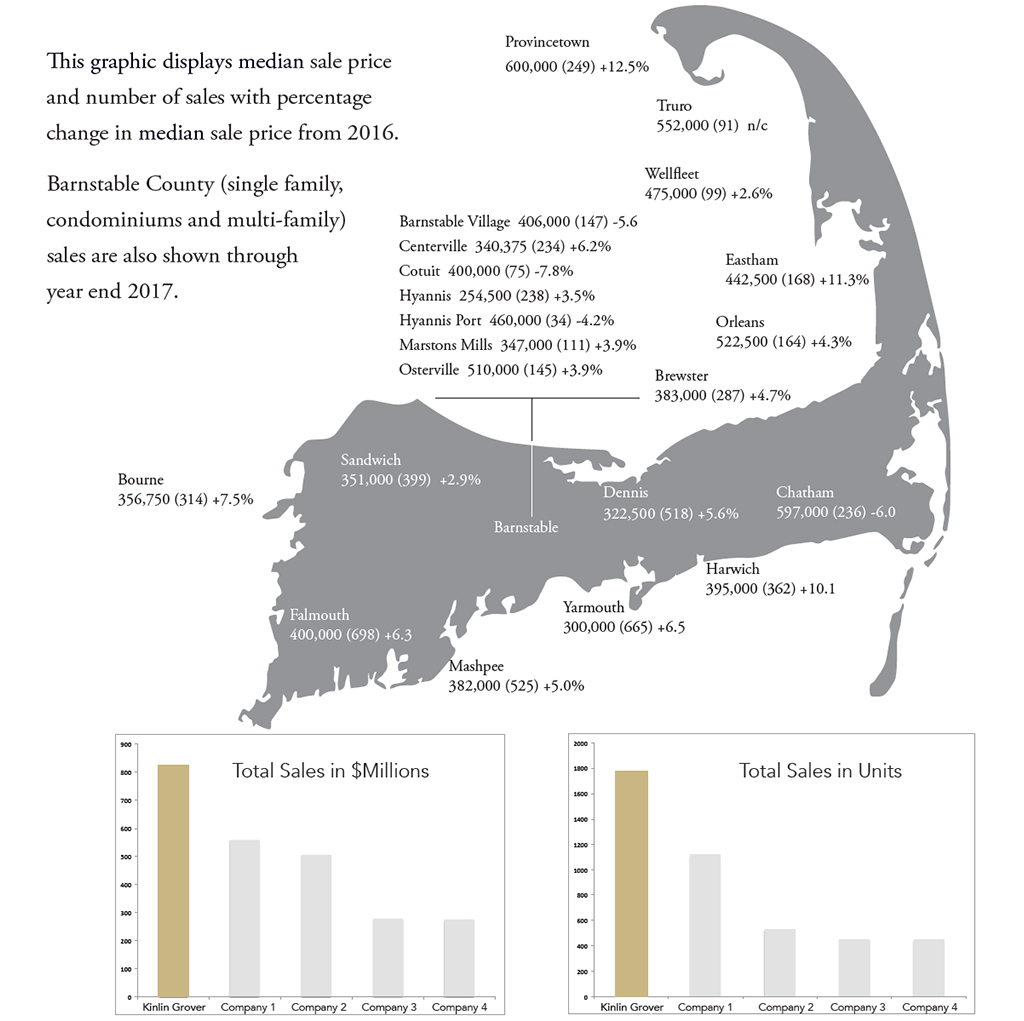
Sellers take note: the Cape Cod real estate market needs inventory! If you are thinking of selling your Cape Cod home, the time is now. Median sale price is up 5.7% and days on market continue to fall - down 20.5% year over year. The lack of inventory is finally putting pressure on sale price, and well-priced homes are selling within days of going on the market. Buyers are active and ready for the right home. Noticeably hot markets on Cape Cod are Provincetown (up 32.1%), Sandwich (up 19.5%), Eastham (up 22.1%), Brewster (up 12.3%) and Harwich (up 12.3%). However, all markets remain extremely active.

| All Kinlin Grover Sales | 2016 | 2017 | % Change |
|---|---|---|---|
| Sales | 1456 | 1428 | - 1.9 |
| Average Sale Price | $488,543 | $474,732 | - 2.8 |
| Median Sale Price | $380,000 | $383,500 | - 11.3 |
| Cape Cod High-End Single Family |
2016 | 2017 | % Change |
|---|---|---|---|
| Sales | 375 | 378 | n / c |
| Average Sale Price | $1,869,368 | $1,759,192 | - 5.9 |
| Median Sale Price | $1,430,000 | $1,445,850 | + 1.0 |
| Cape Cod Condominiums | 2016 | 2017 | % Change |
|---|---|---|---|
| Sales | 1022 | 1070 | n/c |
| Average Sale Price | $332,590 | $344,387 | + 3.5 |
| Median Sale Price | $274,500 | $279,450 | + 1.8 |
| Days On Market | 152 | 121 | - 20.0 |
| Cape Cod Single Family Sales |
2016 | 2017 | % Change |
|---|---|---|---|
| Sales | 4370 | 4176 | - 4.4 |
| Average Sale Price | $522,368 | $546,030 | + 4.4 |
| Median Sale Price | $375,000 | $399,900 | + 3.8 |
| Days On Market | 141 | 120 | - 14.8 |
| Commercial and Land | 2016 | 2017 | % Change |
|---|---|---|---|
| Sales | 210 | 220 | + 7.9 |
| Average Sale Price | $367,919 | $294,546 | - 19.8 |
| Median Sale Price | $182,250 | $195,000 | + 6.7 |
| Days On Market | 358 | 311 | - 13.1 |
| Residential Sales Distribution |
2016 | 2017 | % Change |
|---|---|---|---|
| Under $350,000 | 2612 | 2198 | - 15.8 |
| $350,000 - $499,999 | 1416 | 1489 | + 4.9 |
| $500,000 - $749,999 | 687 | 885 | + 22.4 |
| $750,000 - $999,999 | 264 | 328 | + 19.5 |
| $1 Million+ | 374 | 383 | + 2.3 |