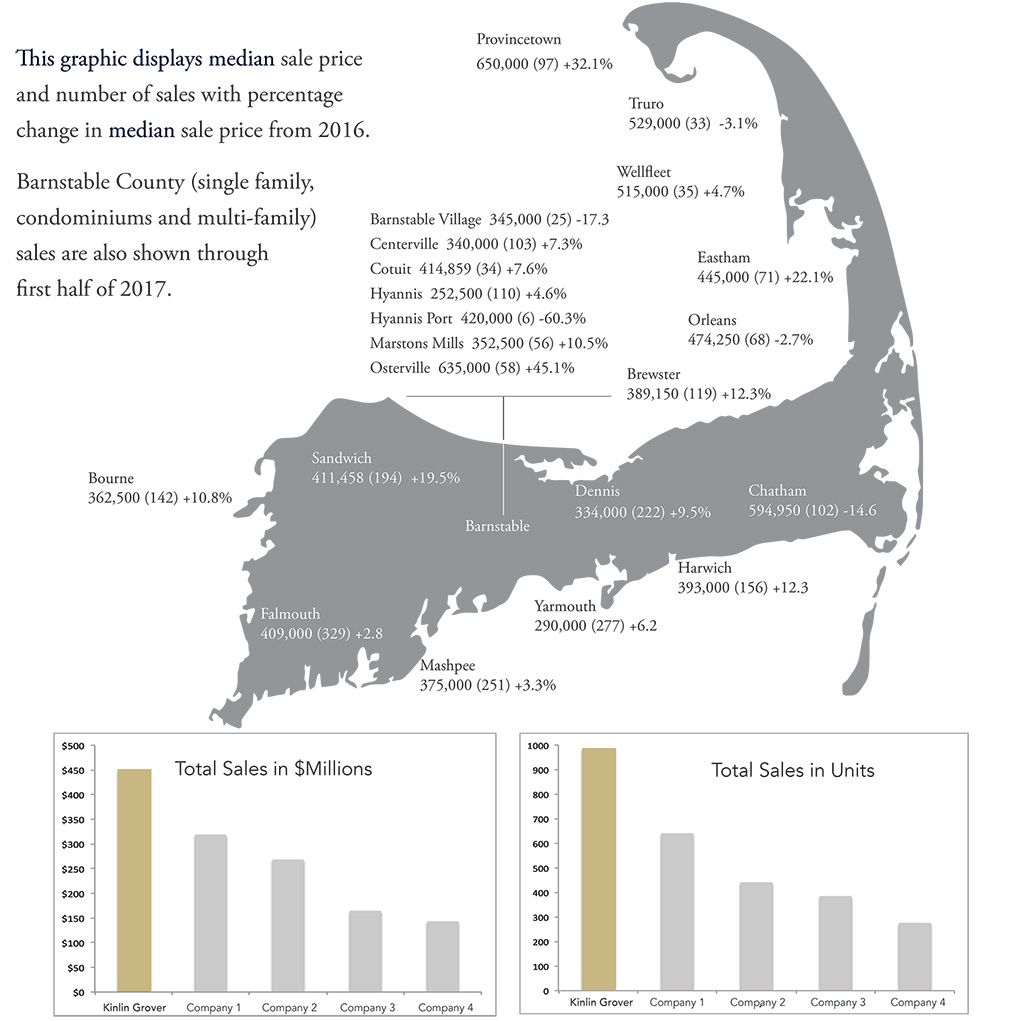
Sellers take note: the Cape Cod real estate market needs inventory! If you are thinking of selling your Cape Cod home, the time is now. Median sale price is up 5.7% and days on market continue to fall - down 20.5% year over year. The lack of inventory is finally putting pressure on sale price, and well-priced homes are selling within days of going on the market. Buyers are active and ready for the right home. Noticeably hot markets on Cape Cod are Provincetown (up 32.1%), Sandwich (up 19.5%), Eastham (up 22.1%), Brewster (up 12.3%) and Harwich (up 12.3%). However, all markets remain extremely active.

| All Kinlin Grover Sales | 2016 | 2017 | % Change |
|---|---|---|---|
| Sales | 652 | 688 | + 5.5 |
| Average Sale Price | $442,215 | $462,105 | + 4.5 |
| Median Sale Price | $364,450 | $383,500 | +5.2 |
| Cape Cod High-End Single Family |
2016 | 2017 | % Change |
|---|---|---|---|
| Sales | 159 | 171 | + 7.5 |
| Average Sale Price | $1,997,974 | $1,902,214 | - 4.8 |
| Median Sale Price | $1,495,000 | $1,495,000 | n/c |
| Cape Cod Condominiums | 2016 | 2017 | % Change |
|---|---|---|---|
| Sales | 472 | 476 | n/c |
| Average Sale Price | $327,000 | $332,050 | + 1.5 |
| Median Sale Price | $268,000 | $260,000 | - 3.0 |
| Days On Market | 175 | 133 | - 24.0 |
| Cape Cod Single Family Sales |
2016 | 2017 | % Change |
|---|---|---|---|
| Sales | 2066 | 2005 | - 3.0 |
| Average Sale Price | $500,374 | $531,221 | + 6.2 |
| Median Sale Price | $369,000 | $390,000 | + 5.7 |
| Days On Market | 161 | 128 | - 20.5 |
| Commercial and Land | 2016 | 2017 | % Change |
|---|---|---|---|
| Sales | 116 | 133 | + 14.7 |
| Average Sale Price | $367,281 | $343,175 | - 6.5 |
| Median Sale Price | $222,450 | $230,000 | + 3.4 |
| Days On Market | 359 | 293 | - 18.4 |
| Residential Sales Distribution |
2016 | 2017 | % Change |
|---|---|---|---|
| Under $350,000 | 1282 | 1158 | - 9.7 |
| $350,000 - $499,999 | 621 | 752 | + 21.1 |
| $500,000 - $749,999 | 365 | 423 | + 15.9 |
| $750,000 - $999,999 | 126 | 163 | + 29.4 |
| $1 Million+ | 165 | 199 | + 20.6 |