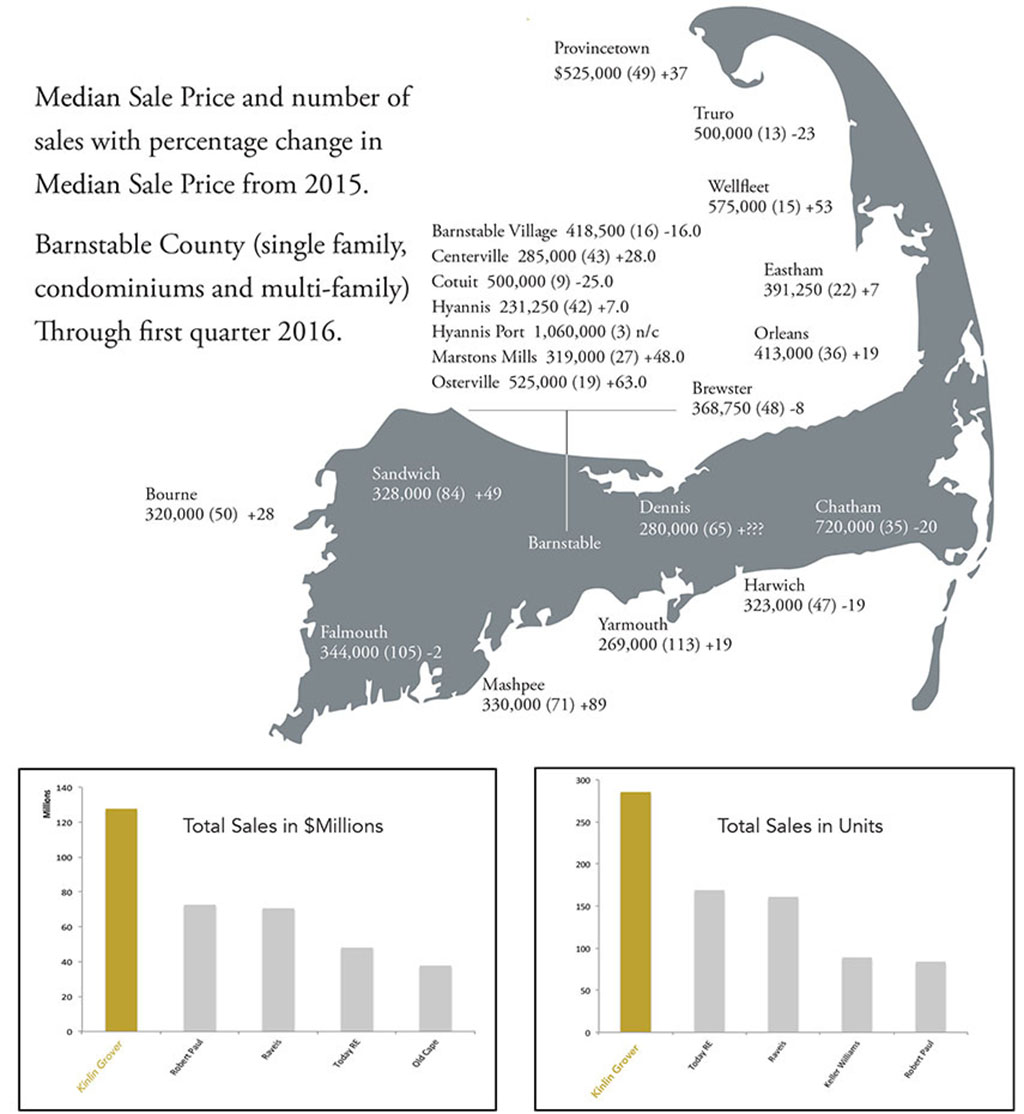
Spring has arrived on Cape Cod, and while the weather warms up, so does the real estate market. Sales volume on The Cape is up 10% while business at Kinlin Grover is up 14%. Cape-wide, condominium sales volume is up 17% while commercial and land sales are up a robust 38% yearover-year. Meanwhile, the average sales price for homes on Cape Cod is down slightly to $500,000 while condominium prices remain unchanged at $320,000. This trend is unlikely to continue as the strong activity across The Cape indicates that prices should edge higher as we move further into the selling season.
| All Kinlin Grover Sales | 2015 | 2016 | % Change |
|---|---|---|---|
| Sales | 202 | 234 | + 14.0 |
| Average Sale Price | $503,728 | $448,870 | - 11.0 |
| Median Sale Price | $385,000 | $352,500 | - 8.0 |
| Days On Market | 161 | 148 | - 8.0 |
| Cape Cod High-End Single Family |
2015 | 2016 | % Change |
|---|---|---|---|
| Sales | 86 | 87 | 1.0 |
| Average Sale Price | $1,464,834 | $1,536,942 | + 5.0 |
| Median Sale Price | $1,095,000 | $1,100,000 | n/c |
| Days On Market | 190 | 280 | + 32.0 |
| Cape Cod Condominiums | 2015 | 2016 | % Change |
|---|---|---|---|
| Sales | 155 | 187 | + 17.0 |
| Average Sale Price | $320,635 | $319,869 | n/c |
| Median Sale Price | $270,000 | $261,000 | - 3.0 |
| Days On Market | 167 | 152 | - 3.0 |
| Cape Cod Single Family Sales |
2015 | 2016 | % Change |
|---|---|---|---|
| Sales | 636 | 710 | + 10.0 |
| Average Sale Price | $509,948 | $499,542 | - 2.0 |
| Median Sale Price | $364,500 | $341,250 | -2.0 |
| Days On Market | 158 | 160 | + 1.0 |
| Commercial and Land | 2015 | 2016 | % Change |
|---|---|---|---|
| Sales | 48 | 78 | + 38.0 |
| Average Sale Price | $435,542 | $352,769 | - 19.0 |
| Median Sale Price | $303,140 | $257,110 | - 15.0 |
| Days On Market | 310 | 266 | + 2.1 |
| Residential Sales Distribution |
2015 | 2016 | % Change |
|---|---|---|---|
| Under $350,000 | 399 | 486 | + 18.0 |
| $350,000 - $499,999 | 192 | 192 | n/c |
| $500,000 - $749,999 | 107 | 121 | + 12.0 |
| $750,000 - $999,999 | 41 | 42 | + 2.0 |
| $1 Million+ | 49 | 54 | + 9.0 |