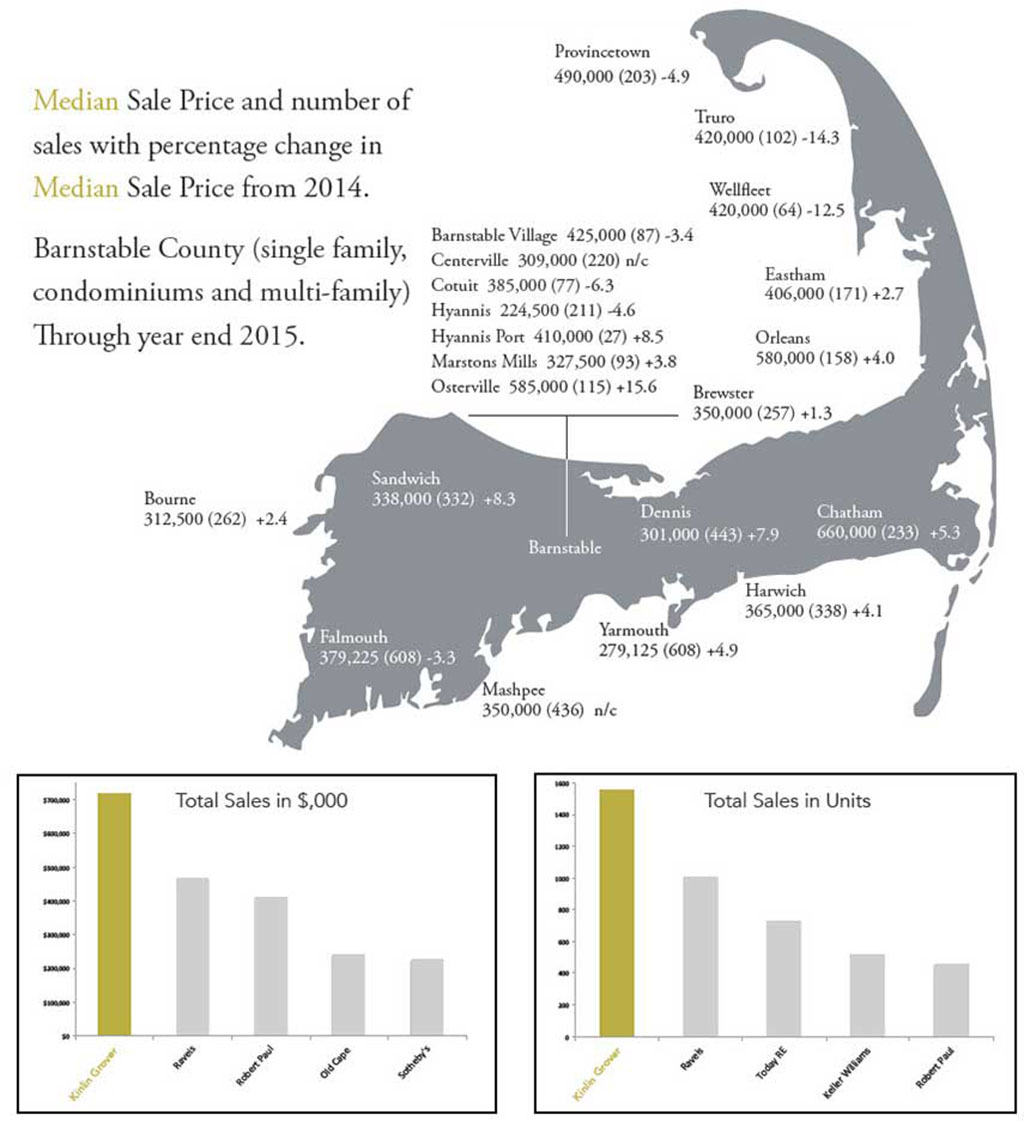
As we turn the corner on another year, we are pleased to report that the real estate market on Cape Cod is healthy and all signals are pointing to a strong 2016. Sales are up more than 7% and the median sale price is up 3%. Days on market continues to fall, indicating tight inventories. Of particular note is the 19.8% increase in sales distribution in the "mid range" market of $500,000 - $749,999. With the Federal Reserve having recently raised its benchmark short term rate from zero, now is a great time to buy and sell - before mortgage interest rates follow suit.

| All Kinlin Grover Sales | 2014 | 2015 | % Change |
|---|---|---|---|
| Sales | 1531 | 1623 | +5.7 |
| Average Sale Price | $476,960 | $463,034 | -2.9 |
| Median Sale Price | $379,000 | $367,500 | -3.0 |
| Days On Market | 148 | 141 | -4.7 |
| Cape Cod High-End Single Family |
2014 | 2015 | % Change |
|---|---|---|---|
| Sales | 299 | 305 | +2.0 |
| Average Sale Price | $1,983,907 | $1,947,868 | -1.8 |
| Median Sale Price | $1,563,000 | $1,500,000 | -4.0 |
| Days On Market | 260 | 221 | -15.0 |
| Cape Cod Condominiums | 2014 | 2015 | % Change |
|---|---|---|---|
| Sales | 963 | 1024 | +6.0 |
| Average Sale Price | $310,831 | $307,949 | -1.0 |
| Median Sale Price | $275,000 | $268,500 | -2.4 |
| Days On Market | 154 | 133 | -13.6 |
| Cape Cod Single Family Sales |
2014 | 2015 | % Change |
|---|---|---|---|
| Sales | 3,692 | 3,965 | +7.4 |
| Average Sale Price | $520,535 | $519,481 | n/c |
| Median Sale Price | $357,500 | $368,000 | +3.0 |
| Days On Market | 144 | 135 | -6.3 |
| Commercial and Land | 2014 | 2015 | % Change |
|---|---|---|---|
| Sales | 247 | 259 | +4.9 |
| Average Sale Price | $344,986 | $357,952 | -3.9 |
| Median Sale Price | $215,000 | $199,900 | -7.0 |
| Days On Market | 291 | 297 | +2.1 |
| Residential Sales Distribution |
2014 | 2015 | % Change |
|---|---|---|---|
| Under $350,000 | 2,396 | 2,459 | +2.6 |
| $350,000 - $499,999 | 1,101 | 1,223 | +11.0 |
| $500,000 - $749,999 | 606 | 726 | +19.8 |
| $750,000 - $999,999 | 248 | 258 | +4.0 |
| $1 Million+ | 307 | 313 | +1.9 |